Ohio Insure Plan Logo

Indexed Annuity Historical Performance

Get Quotes

Request An
Annuity Quote

Need an annuity? You're in the right place.

Fixed Indexed Annuity Returns

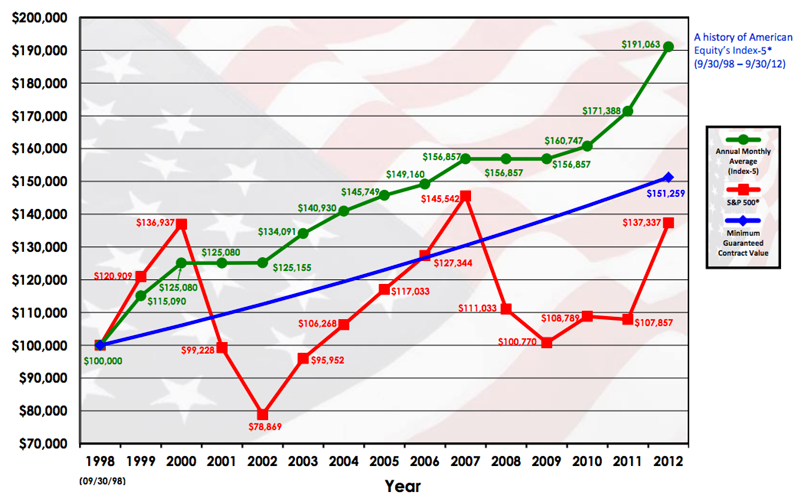
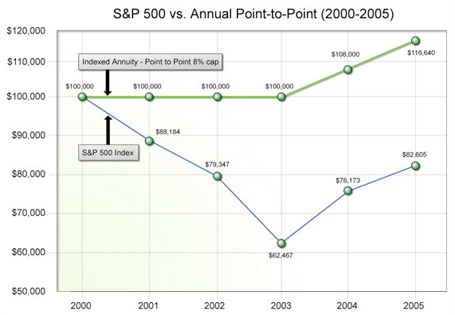
The charts below illustrate past fixed-indexed annuity returns from some of the more common indexed sub-accounts offered by insurance companies. These examples provide some context as to what kind of returns indexed annuity owners might expect.

It is important to understand that these charts only illustrate a few common accounts. If you are researching indexed annuities, you know there are several different indexing strategies to choose from. The ones you choose and when you invest will go a long way in determining your overall future returns.

Indexed Annuity Performance

Indexed Annuity Historical Performance Example

This historical indexed annuity example illustrates a monthly averaging strategy using the S&P 500 as the tracking index. The green line is the annuity performance and the red line shows the returns of the S&P 500, excluding dividends. (The blue line is the Minimum Guaranteed Value of the annuity which did not come into play as the index returns were greater.)

Indexed annuities are popular simply because they do not lose value when the market goes down. During the last two major market corrections in 2000-2002 and 2007-2009, indexed annuities did not lose principal or interest gains from earlier years. And asset fees (if there are any) are not assessed during down years.

It’s important to understand that there are different variables that will affect your overall returns. You’ll want to know about any caps, participation rates and/or yearly fees. Some annuities will undoubtedly outperform others based on these parameters. The example above might be best described as an indexed annuity with average returns during the last decade.

Fixed Indexed Annuity Annual Point-To-Point Strategy

The second graph below illustrates a “point-to-point” indexed annuity strategy. This is a good time to reinforce the concept that most indexed annuities offer several indexing methods that index into different markets – like the Dow Jones, NASDAQ, Russell 2000, etc.

Like most point-to-point strategies, this account has a predetermined cap – or ceiling. Interest is credited based on the difference between the starting and ending value of the S&P 500® during a one-year period. There are not too many moving parts with this very conservative strategy.

This account had an 8% cap which means the annuity can only increase by a maximum of 8% regardless of the performance of the underlying index. This strategy is a good one when the market is slowly swinging upward while perhaps facing some economic headwinds.

It’s important to know that interest rates have been on the rise the last several years. When rates rise, so do caps and participation rates. This means you can lock in much higher caps for growth. At present, we see some S&P 500 caps over 14%! That allows for fantastic growth opportunities should the indexes increase in kind.

Fixed Indexed Annuity

Additional Indexing Choices & Strategies

The two examples above only represent a very small percentage of the many methods used to credit interest in an equity-indexed annuity. Other indexed accounts calculate interest based on a high water mark, a monthly cap, volatility control, multiple indexing strategies, uncapped strategies, or one of several others available.

Almost all indexed annuities will have several interest crediting strategies to choose from. Accordingly, the results above are not indicative of how all equity-indexed annuities performed during the same time period. Accounts funded in January will have different returns than those in June for example.

Almost all indexed annuities will offer several indexing strategies tied to the S&P 500, but the NASDAQ, Dow Jones, Russell 2000, bond & gold indexes, and foreign exchanges are also available – many times within the same account. More recently companies have designed proprietary indexes to beat the market as well as those that credit interest when the market goes down.

Optional Yearly Fixed Interest Sub-Account

The performance examples above assume no funds were allocated to the annuity’s fixed interest sub-account at any time. However, owners can choose to allocate a portion of their premium to the optional fixed account when the overall market is not performing well. This is usually for a one year term and the funds can be reallocated the following year.

Each year, owners can reallocate all or a portion of their funds between the various indexed and fixed options without cost or penalty. This allows consumers to sit out poor market cycles in the fixed account and then return to market-based indexes during better cycles.

View Our Presentation On Indexed Annuity Accounts

Annuity PresentationNot all annuities are created equal and some will far outperform others over just a few years. It’s important to understand what factors will give your annuity the best chance to grow over the long run.

Click on our presentation to the left to learn more about annuities. Knowledge is power. By learning more about these innovative investment accounts you will know what questions to ask us when considering an insurance policy for your retirement portfolio.

Request Quotes, Illustrations & Information

Fixed-indexed annuities are especially valuable for those looking to protect and preserve their assets without having to sacrifice gains. The examples above highlight this strategy. They demonstrate the potential annuities offer during bull markets and the security they provide during bear cycles.

We represent dozens of annuity carriers providing hundreds of indexed annuity strategies to our clients. Contact us to learn more about the best options available for your retirement needs.